Following chart is the top 10 industries among Happy Returns's customer, the top 3 are:
| Regions | Stores | Percentage |
|---|---|---|
| United States | 16 | 88.89% |
| Hong Kong | 1 | 5.56% |
| United Arab Emirates | 1 | 5.56% |
Following chart is the top 10 industries among Happy Returns's customer, the top 3 are:
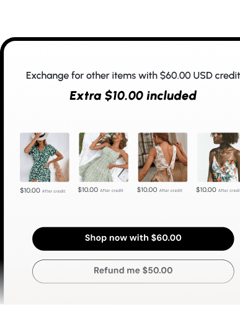
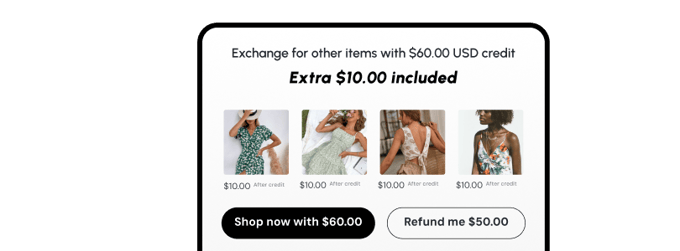
Apparel: about 50.00% of Happy Returns's customers are Apparel stores.
Home & Garden: about 11.11% of Happy Returns's customers are Home & Garden stores.
Health: about 11.11% of Happy Returns's customers are Health stores.
| Categories | Stores | Percentage |
|---|---|---|
| Apparel | 9 | 50.00% |
| Home & Garden | 2 | 11.11% |
| Health | 2 | 11.11% |
| Beauty & Fitness | 2 | 11.11% |
| Sports | 1 | 5.56% |
| Toys & Hobbies | 1 | 5.56% |
| Business & Industrial | 1 | 5.56% |
| Software | Stores | Percentage |
|---|---|---|
| Facebook Pixel | 16 | 13.45% |
| Google Analytics | 16 | 13.45% |
| Google Tag Manager | 15 | 12.61% |
| Apple Pay | 14 | 11.76% |
| Shop Pay | 13 | 10.92% |
| Klaviyo | 12 | 10.08% |
| Google Pay | 11 | 9.24% |
| Attentive | 9 | 7.56% |
| TikTok Pixel | 8 | 6.72% |
| Gorgias | 5 | 4.20% |
Following chart is the monthly sales generated by Happy Returns's customers, categorized to different countries and regions. The top 3 are:
| Regions | Estimated Sales | Percentage |
|---|---|---|
| United States | $507.12M | 59.32% |
| Hong Kong | $1.54M | 0.18% |
| United Arab Emirates | $0.00 | <0.01% |
| Others | $346.23M | 40.50% |
Following chart is the monthly sales generated by Happy Returns's customers, categorized to different industries. The top 3 are:
| Categories | Estimated Sales | Percentage |
|---|---|---|
| Health | $141.77M | 16.58% |
| Apparel | $123.36M | 14.43% |
| Business & Industrial | $117.45M | 13.74% |
| Home & Garden | $91.82M | 10.74% |
| Toys & Hobbies | $33.67M | 3.94% |
| Beauty & Fitness | $15.84M | 1.85% |
| Sports | $0.00 | <0.01% |
| Others | $330.97M | 38.72% |
Following chart is the monthly app spend of Happy Returns's customers, categorized to different countries and regions. The top 3 are:
| Regions | App Spend | Percentage |
|---|---|---|
| United States | $239.82K | 87.30% |
| Hong Kong | $19.49K | 7.10% |
| United Arab Emirates | $15.39K | 5.60% |
Following chart is the monthly app spend of Happy Returns's customers, categorized to different industries. The top 3 are:
| Categories | App Spend | Percentage |
|---|---|---|
| Apparel | $95.42K | 34.73% |
| Health | $50.00K | 18.20% |
| Beauty & Fitness | $29.80K | 10.85% |
| Toys & Hobbies | $14.80K | 5.39% |
| Home & Garden | $13.80K | 5.02% |
| Sports | $499.00 | 0.18% |
| Business & Industrial | $0.00 | <0.01% |
| Others | $70.40K | 25.63% |