Ultimate Guide to Shipment Analytics in 2024
In this article, we will discuss the benefits of shipment analytics and provide a comprehensive guide to all kinds of shipment reports and how to use their key metrics to optimize your business.

Shipping is now an important part of the consumer experience. To stay profitable and satisfy customers, businesses need to improve their delivery processes. By using shipment analytics, businesses can gain insights, spot bottlenecks, and find opportunities for improvement.
What are Shipment Analytics?
Shipment analytics refers to the use of data to gain a comprehensive understanding of your shipping performance. It is a powerful tool that can help you optimize your shipping processes and enhance your customer experience.
Why Do You Need Shipment Analytics?
Shipping and tracking are important parts of the post-purchase experience. Nowadays, top brands prioritize the customer experience, and shipment analytics can help monitor the key performance of every stage in the post-purchase process, from order placement to fulfillment, and from fulfillment to delivery. Even the delivery experience after the order has been delivered can be analyzed through this process.
On-Time Report
The most crucial aspect of the post-purchase experience is on-time delivery. Nobody likes delayed shipments, especially not your customers. That's why you need an on-time delivery report.
Ensuring that your packages are delivered to customers on time means that the packages should reach the shoppers' hands on or before the estimated delivery date (EDD). The EDD is typically provided to the customer when they make a purchase and it may be updated if there are any changes to the production or shipping schedule.
The estimated delivery date is an important part of the customer decision-making process. After purchasing, the actual delivery time of the goods determines whether the customer's experience is positive or negative.
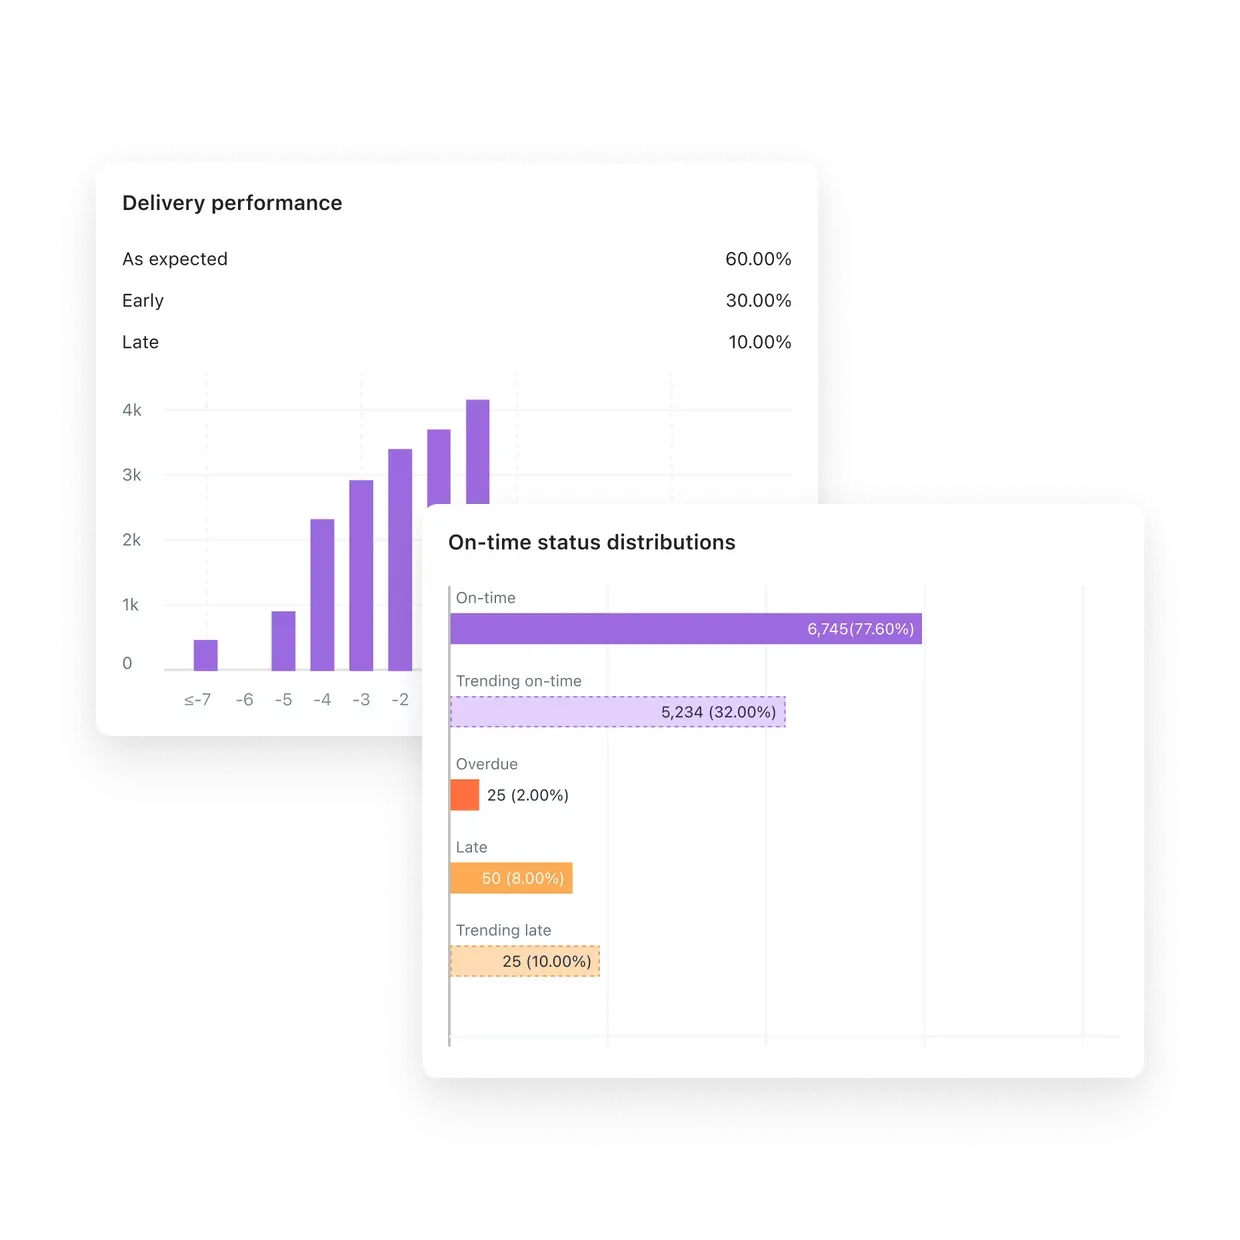
By reviewing the on-time report, you can find out how many of your shipments are delivered on time, late, trending on-time, trending late, and overdue. And use the on-time rate to evaluate the delivery performance of the business over time.
On-time rate = {(On-time shipments/(Late + On-time) shipments) x 100}
The ideal on-time rate is 100%, which of course, is a challenging goal. As we can see from the calculation method mentioned above, to improve the on-time rate, it is necessary to reduce the number of late or failed shipments. This brings us to the analysis of the exceptions report.
Exceptions Report
With exceptions report, merchants can get a detailed overview of what the late packages experience including incorrect address, bad weather, lost in transit, and damaged product.
Key exception metrics often include exception rate, exception shipments, lost, damaged, and returned to sender.
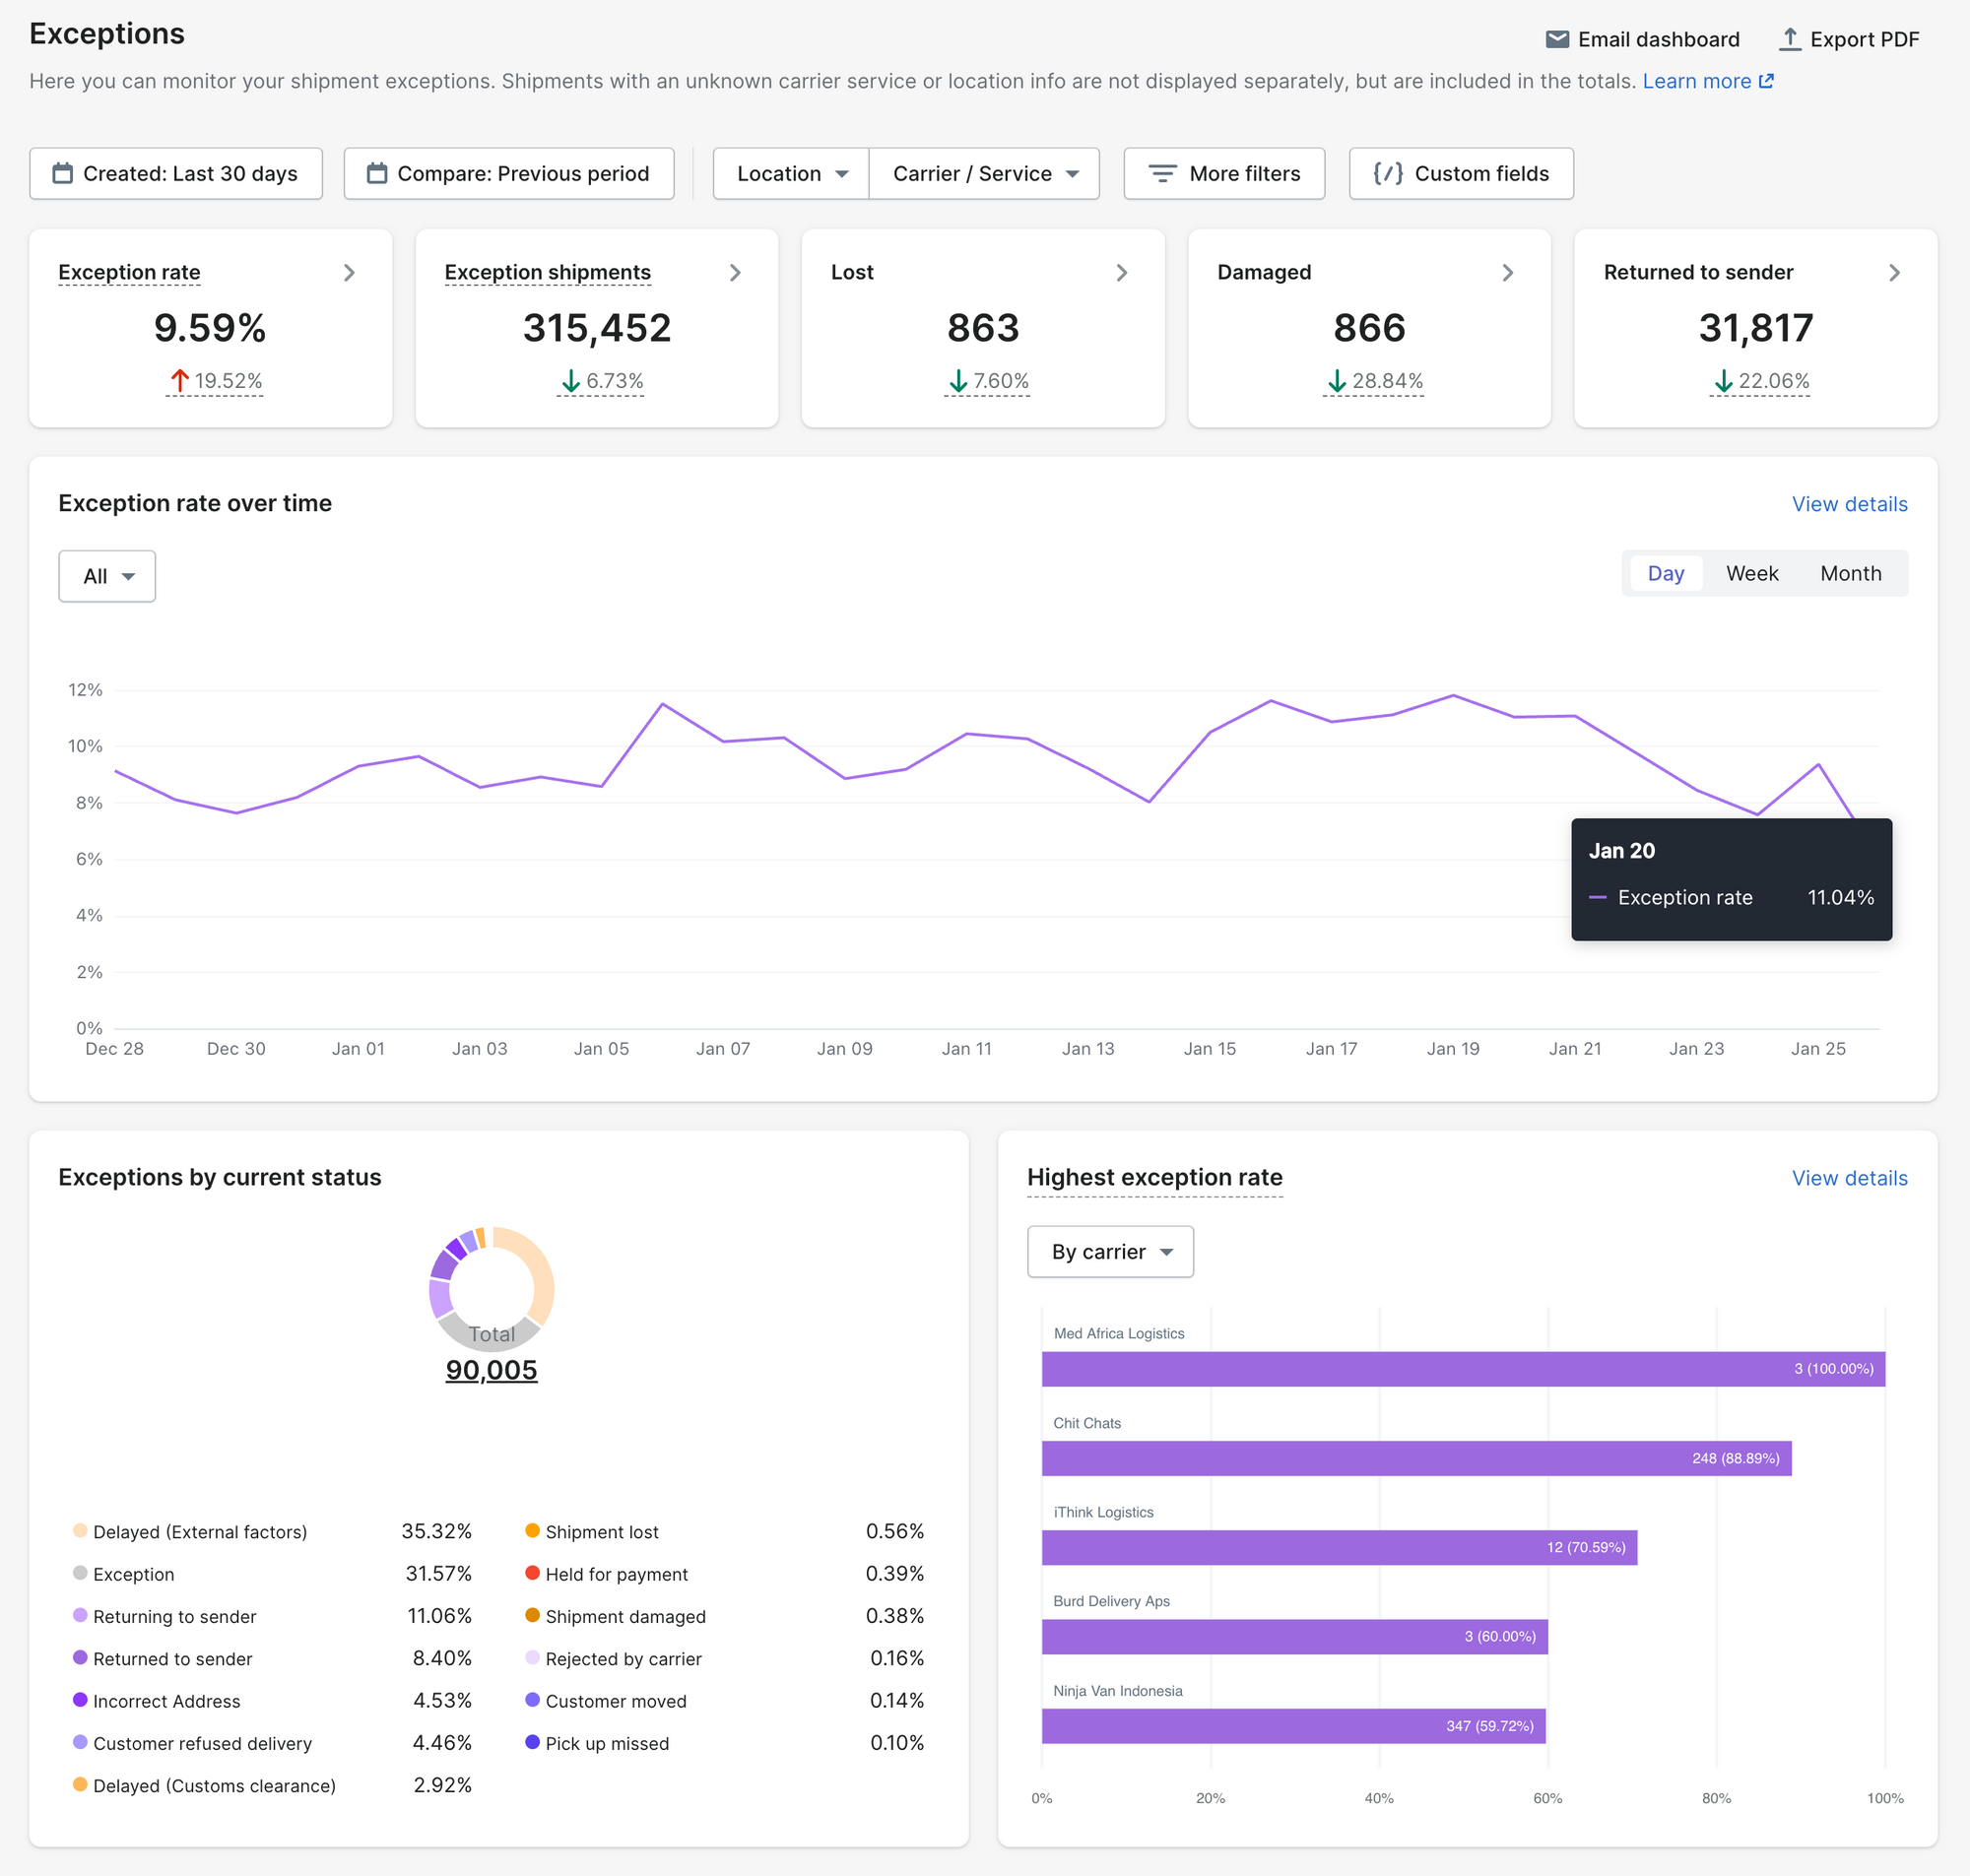
Through the exceptions report, you can select a specific timeframe and then view exceptions by day, week, and month, as well as specific types of exceptions. Another effective way of analyzing is to check the highest exception rate by carriers and destination, analyzing which carriers and locations have generated the most exceptions.
To gain a more detailed understanding of how the selected carrier is performing and to comprehensively track all package information, you need to check the shipment report.
Shipment Report
The shipment report provides detailed and overall data on your shipment performance, including the total number of tracked shipments and the number of packages in various statuses, such as non-delivered, delivered, and exceptions.
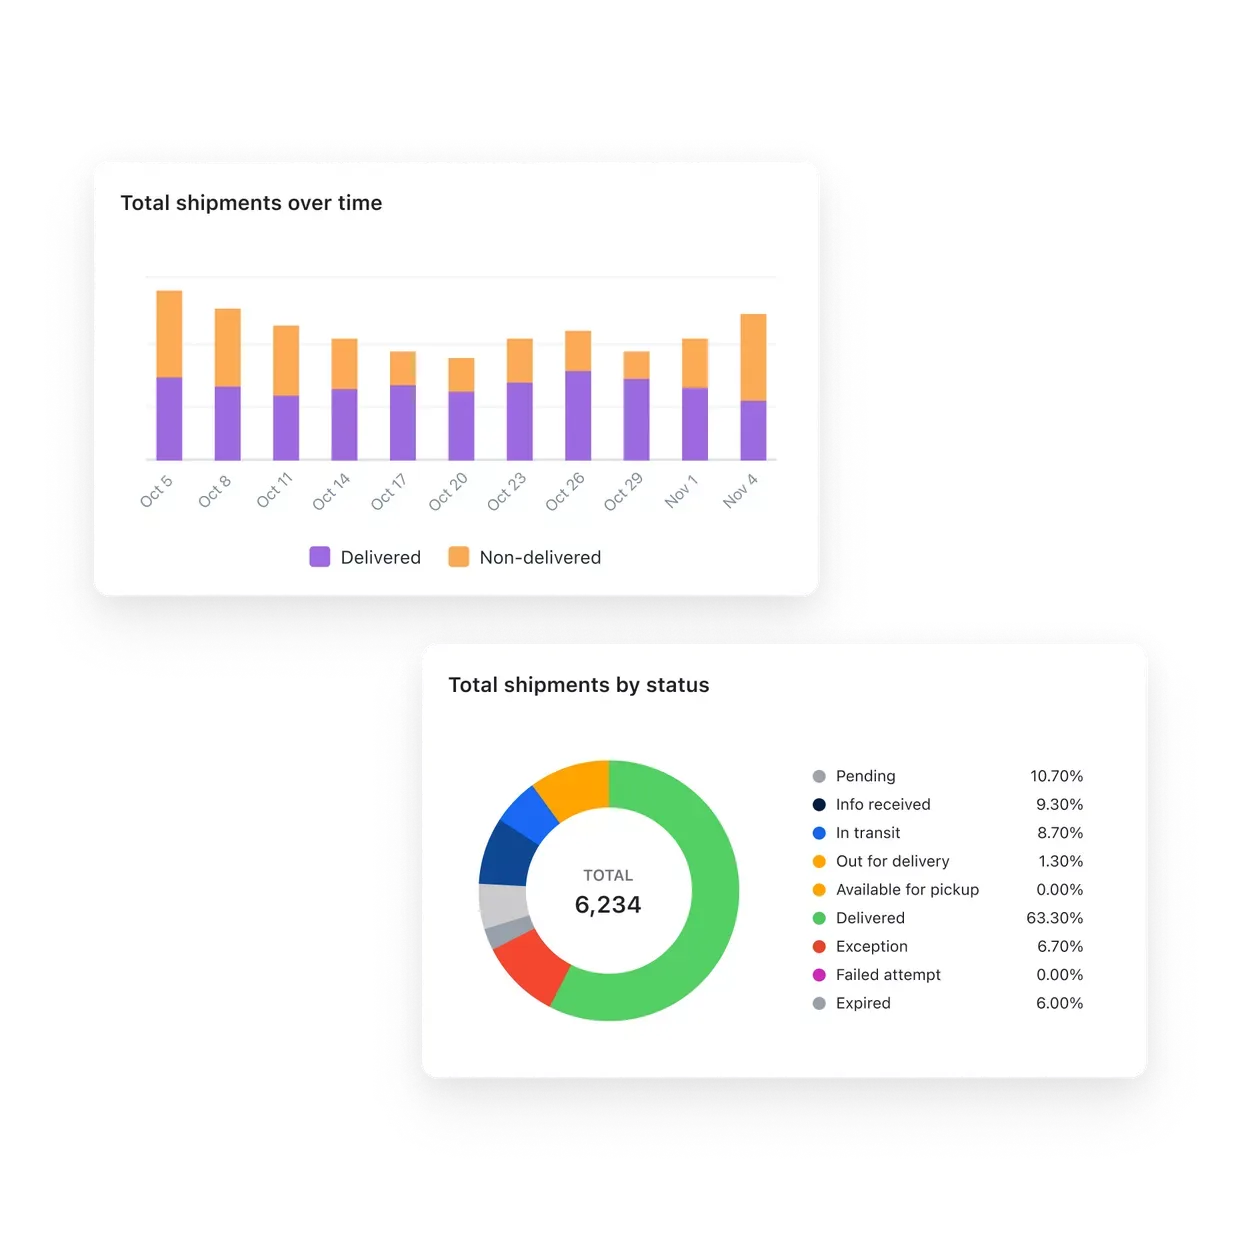
By utilizing these fundamental key metrics, you can use filters to slice and dice reports as per your requirements and obtain more targeted detailed reports. For example, you can analyze the top carriers and top destinations to make informed decisions regarding carrier selection and regional strategies.
Even if ensuring punctuality, no delays, or exceptions, businesses still need to do better and more because customers always want shorter delivery times and get the packages as quickly as possible. By analyzing order-to-delivery time, you will find the breakthrough to improve delivery efficiency.
Order-to-delivery Time Report
The order-to-delivery time is the duration it takes for the customer to receive a shipment after placing an order. This process comprises processing the order, picking up the shipment, and transit, covering the lead time for your shipments from the time the order is created until it is delivered to the customer.
The report can be divided into three parts based on the delivery stage of the package:
- Processing Time Report: From the date on which the order is placed to the date on which the merchants process the order to pickup.
- Pickup Time Report: Time taken by the carriers to pick up the shipment from the merchant’s end
- Transit Time Report: From the date on which the shipment is picked by the carrier for delivery to the date on which the shipment is delivered to the customer.
Analyzing the total three reports under one dashboard to identify supply chain bottlenecks and improve your shipping strategy for enhanced customer satisfaction. As for the transit time report, there are more aspects that can be studied, we will talk about them later.
You can view the average time for each period over time and filter it using date, location, carrier, and service. Some shipping software also provides analysis of time distribution to help users identify patterns and characteristics in the data.
Carrier Transit Time Report
The report allows you to dive into key carrier transit time metrics to understand where longer transits are occurring to optimize delivery rate and reduce holding costs.
Calculating the Transit time
When the shipment is delivered:
- Transit time (in days) = Delivered date - picked-up date
When the shipment is not delivered:
- Transit time (in days) = Current date - picked-up date
Since delivery attempts also involve two situations: successful and unsuccessful, the report also includes delivery attempt analysis. Analyzing successful delivery attempts can be checked by applying filters to view different locations, carriers, store names, etc.
By analyzing all delivery-related reports, you can obtain objective data and results on your shipments. However, to better connect with your customers, you need to directly understand their subjective views on your services. This is where the shipment reviews report comes in handy, as it can help you get a fair idea of how well you are meeting shipping expectations.
Shipment Reviews Report
Analyzing the feedback and reviews from customers about their delivery performance is an essential step in closely monitoring and improving your shipment process. By studying customer feedback data, you can gain valuable insights into areas that may require improvement or lack proper expertise.
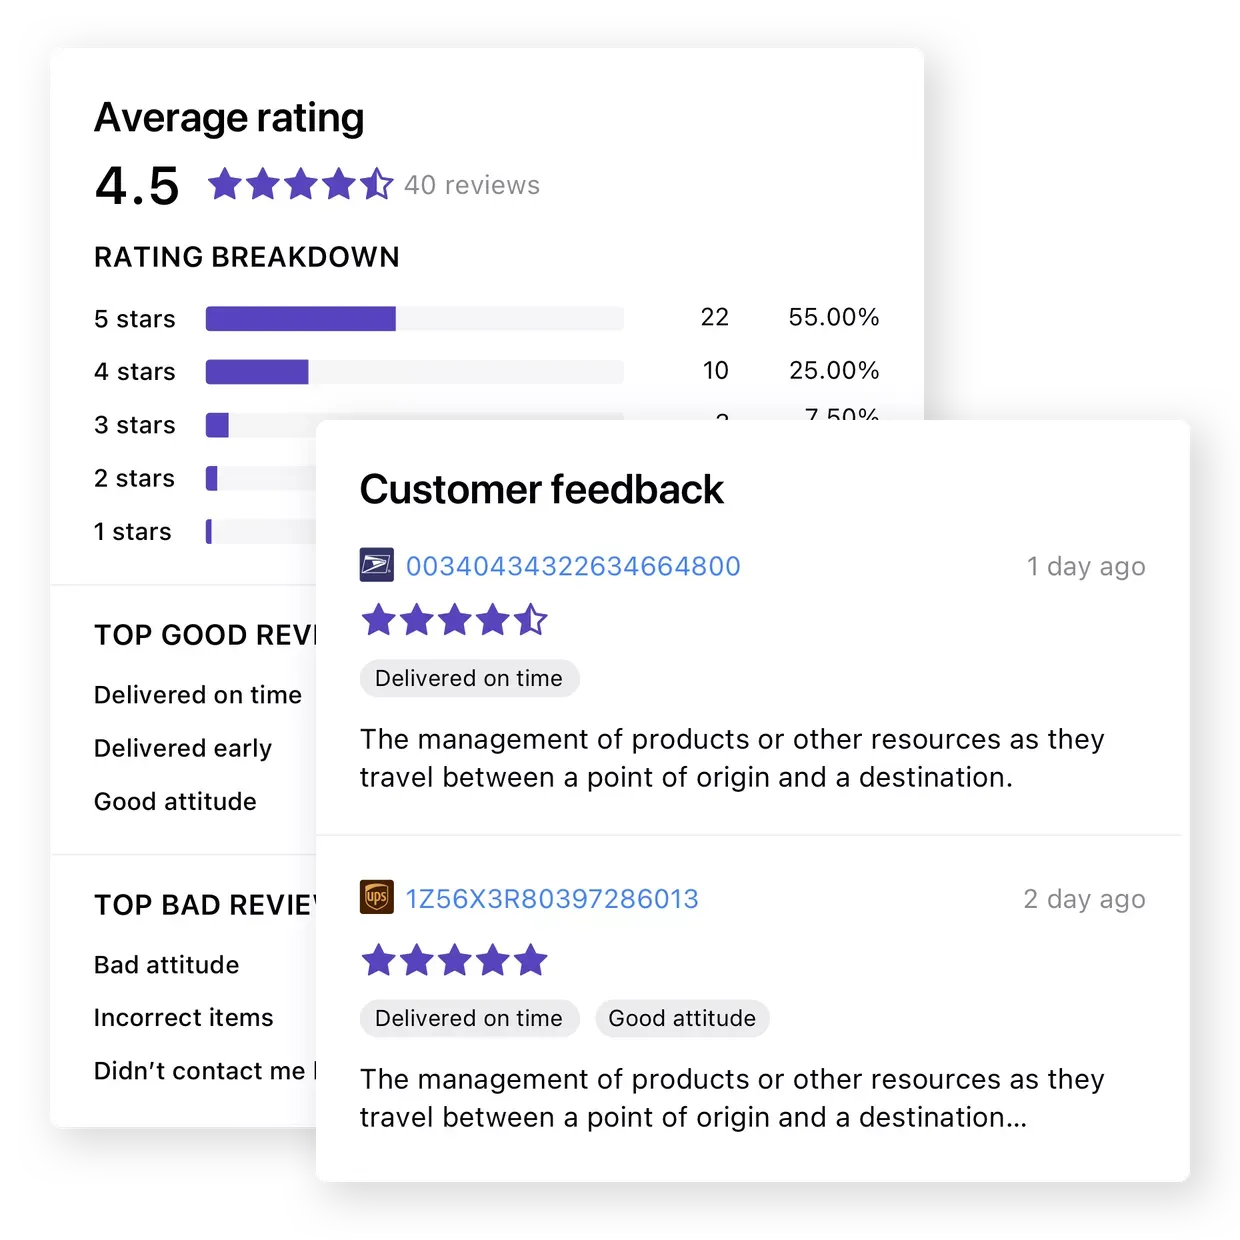
By evaluating the feedback received, you can identify trends, patterns, and common issues that customers may be experiencing with their deliveries.
For example, if customers consistently mention delivery delays, you can assess your logistics processes, carrier performance, or explore alternative shipping options to expedite deliveries.
Top tags help categorize the reviews and allow you to identify common themes or topics in customer feedback that require corrective actions. Understanding the top tags left by customers can provide valuable insights into what enhanced or diminished their delivery experience.
In addition to a comprehensive analysis of your shipping performance, there are other crucial data to understand user preferences and habits.
Tracking Pages Report
Tracking page is a customized webpage, woven with your brand's identity, where customers can track their orders in real time. This report allows you to measure customer engagement and CTR to optimize a cohesive marketing campaign.
It provides data-backed insights for optimizing your tracking pages. You can find the level of engagement and interest of your website visitors by analyzing their behavior and interaction with your website. The often-used metrics are page views, unique visitors, average session duration, and bounce rate.
Product Recommendation Report
The tracking pages report provides data on your marketing performance, allowing you to analyze the clicks and CTR of various marketing elements, including product recommendations on your tracking pages.
Conversion Tracking
If you are using both the tracking page and notification email channels, and both channels are associated with a conversion, the analytics will show the sales data attributed to both channels respectively. When a customer clicks on any marketing elements on your tracking page and then places an order within the attribution window, which is normally 3 days, it is considered a conversion. As for conversions generated by email and SMS channels, you can observe them by viewing the notifications report.
Notifications Report
Shipment notifications, also called delivery notifications, are messages sent by eCommerce merchants to keep customers informed about their orders. To optimize your engagement strategy and gain insights into the performance of your notifications, you can track various key metrics for both email and SMS channels through notifications reports.
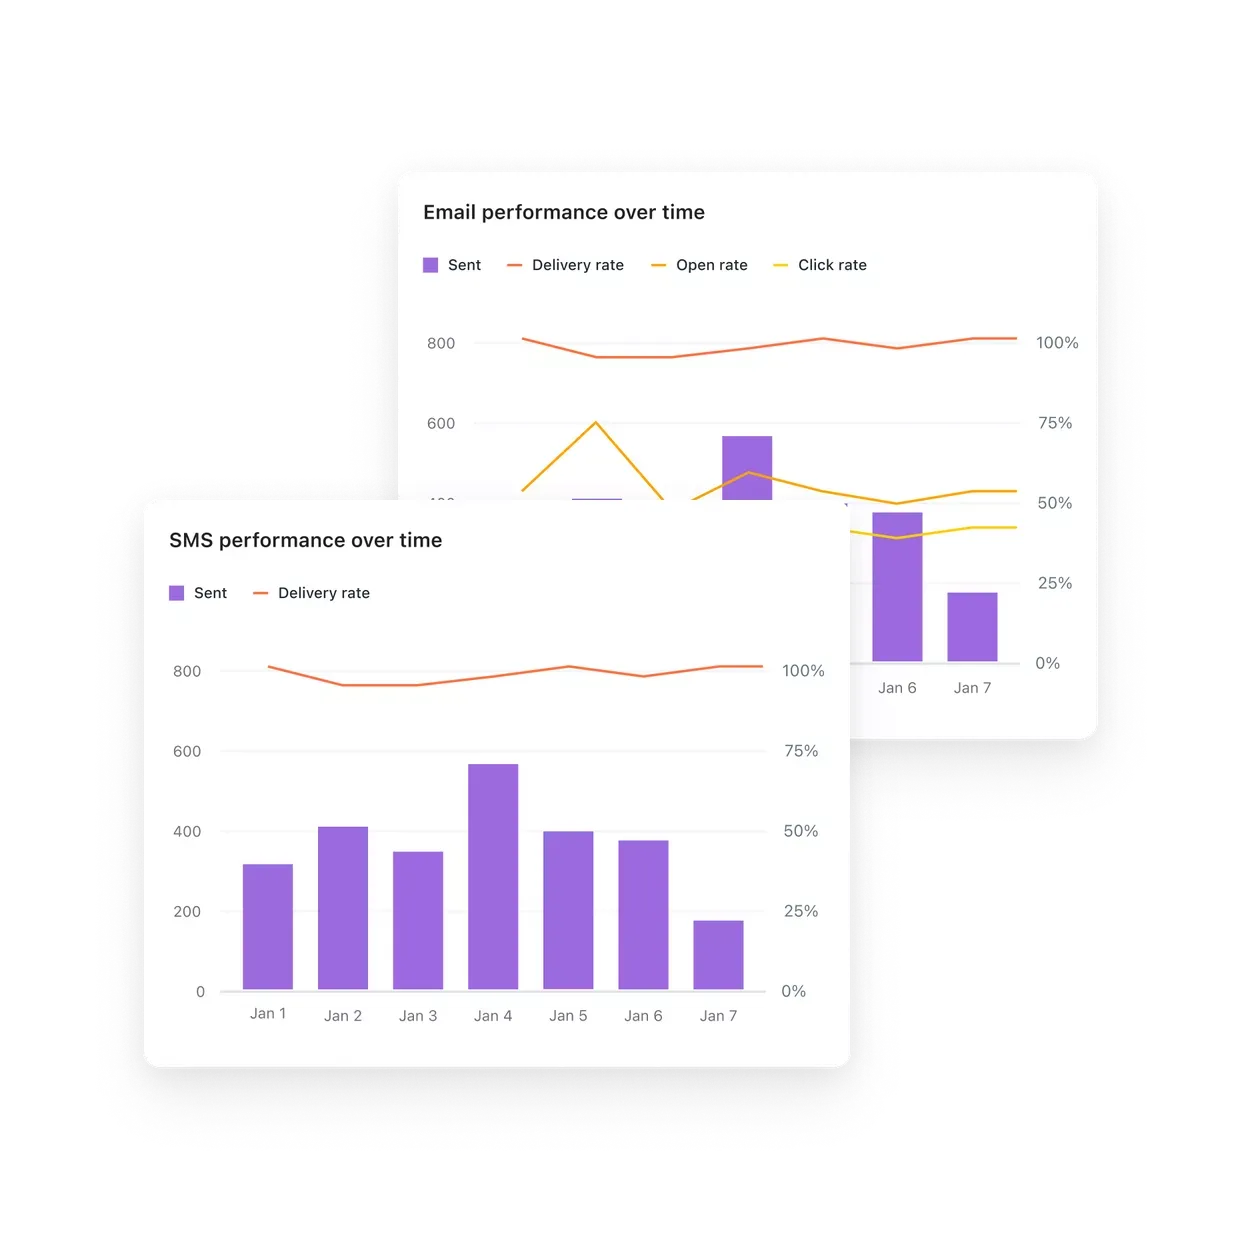
Email and SMS funnel analysis
By tracking the journey from sending notifications to generating engagements, you can identify bottlenecks and improve your conversion rates. Funnel analysis helps you understand the effectiveness of each stage and make data-driven decisions to optimize your engagement strategy.
Additional Features of Shipment Analytics
Certain software provides users with a more comprehensive experience through additional features such as access to a detailed dashboard and advanced reporting actions. These features give users the ability to fine-tune their preferences and personalize their results to achieve more valuable insights.
Customizable Filters
Customizable filters allow you to refine your analysis by slicing and dicing reports. With these filters, you can narrow down the data based on specific criteria such as date ranges, regions, product types, or any other relevant variables. This level of customization enables you to gain more detailed insights and tailor your analysis to meet your specific needs.
PDF & CSV Export
It allows you to export your data and reports in different formats for better management and utilization. By exporting to PDF or CSV, you can easily share your findings with colleagues or stakeholders who may not have direct access to the analytics platform.
Email Report
The email report feature is particularly beneficial for staying updated on important information without actively checking the analytics dashboard. With this feature, you can set up automated reports to be sent to your email inbox at regular intervals (weekly, daily, or monthly). These reports contain the latest updates and data changes, ensuring that you and your team are always informed about key metrics, trends, or any significant changes in the shipment data.
Recommended Software for Shipment Analytics
We have put together a list of the Analytics features of the most popular shipment tracking software available in 2024. Four of them offer basic report types including on-time report, shipment report, transit time report, and tracking pages report. However, AfterShip offers the most comprehensive analytics, which covers all stages in the post-purchase process, ranging from order placement to fulfillment, and from fulfillment to delivery.
| Analytics | AfterShip | Parcel Panel | track123 | parcelLab |
|---|---|---|---|---|
| On-Time Report | ✅ | ✅ | ||
| Exceptions Report | ✅ | |||
| Shipment Report | ✅ | ✅ | ✅ | ✅ |
| Order-to-delivery Time Report | ✅ | |||
| Carrier Transit Time Report | ✅ | ✅ | ✅ | ✅ |
| Shipment Reviews Report | ✅ | |||
| Tracking Pages Report | ✅ | ✅ | ✅ | ✅ |
| Notification Report | ✅ | ✅ | ||
| Email Report | ✅ | |||
| PDF & CSV Export | ✅ |
Conclusion
If you are looking to learn more about shipment analytics or if your business is experiencing specific analytics needs, we are here to help. Book a demo now!


Comments ()