eCommerce Statistics & Trends 2023
The world of eCommerce continues to evolve rapidly, shaping the way businesses operate and consumers shop. In this article, we will explore the latest statistics andd insights surrounding eCommerce in 2023, as well as emerging trends for 2024.

The year 2023 has witnessed remarkable growth and transformation in the eCommerce industry worldwide. This article provides comprehensive data, insights, and trends that highlight the current landscape and future projections of eCommerce. From industry growth to online consumer behavior, we delve into the statistics shaping the digital retail space. Additionally, we explore US-specific data and conclude with key trends to watch out for in 2024.
- eCommerce Industry Growth
- Online Consumer Behavior
- Merchants Statistics
- US eCommerce Statistics 2023
- eCommerce Trends in 2024
eCommerce Industry Growth
The substantial increase in online retail sales demonstrates consumers' growing preference for the convenience and accessibility offered by eCommerce platforms.
1. Online Retail Sales Worldwide
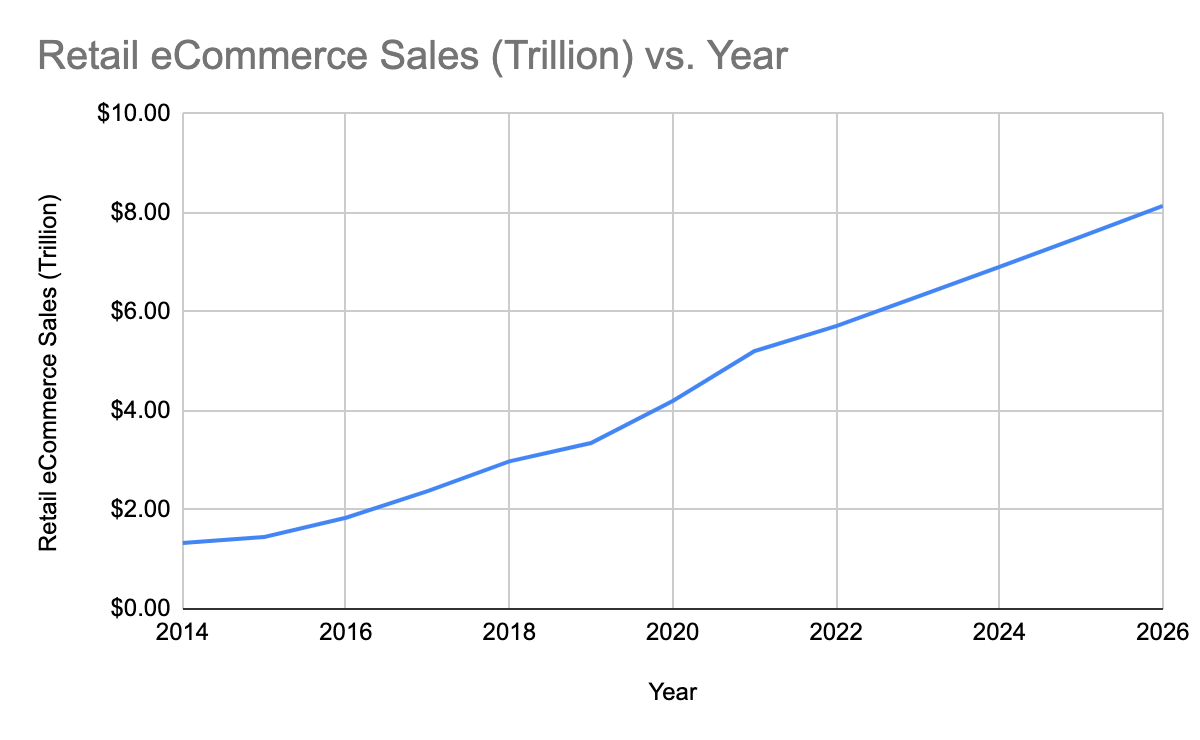
Online retail sales have reached an impressive valuation of $6.31 trillion globally in 2023. This figure is expected to surge by over 50% within the next four years, indicating a remarkable growth trajectory for the eCommerce industry.
2. Share of E-commerce in Total Retail Sales
As of 2023, eCommerce accounts for 21.5% of total retail sales. This percentage showcases the expanding significance of online transactions in the overall retail sector. The significant impact of online shopping on overall retail sales highlights the importance for businesses to have a strong online presence and enhance their digital strategies to stay competitive.
Source: Yaguara
3. Total Stores by Region
Analyzing the total number of eCommerce stores across different regions allows us to identify areas of high market penetration and potential growth opportunities. The United States has the most online stores compared to other platforms we track, which shows that its eCommerce economy is thriving. Moreover, the United Kingdom and Brazil also have a significant number of online shops, making up 6.47% and 4.88% respectively of the global online store market.

Source: AfterShip eCommerce Statistics
4. Estimated Monthly Sales by Region
A closer look at the estimated monthly sales in key regions provides valuable insights into consumer purchasing patterns. The United States is at the forefront of the eCommerce sector, experiencing remarkable achievements by generating monthly sales amounting to $126.38 trillion. This exceptional performance solidifies its position as the dominant player in the market, with a substantial share of 27.59%. Refer to the table below:

Source: AfterShip eCommerce Statistics
5. Total Stores by Category
Understanding the popularity of eCommerce stores in different categories helps us spot market trends and shape our business plans according to what customers prefer. From our observations, Apparel is the most competitive industry, as it holds 17.76% of the market share. Home & Garden and Food & Drink are also popular categories, ranking second and third respectively.

Source: AfterShip eCommerce Statistics
Online Consumer Behavior
Numbers don't lie. It is necessary for us to understand users' consumption habits through data to make business strategic deployments according to these situations.
1. Number of Online Shoppers Worldwide
The number of online shoppers worldwide has soared to a staggering 2.64 billion in 2023. The exponential growth in the number of online shoppers signifies the increasing acceptance and trust consumers have placed in eCommerce, presenting significant opportunities for businesses to tap into new markets.

Source: Yaguara
2. Product Search Behavior: Google as the Preferred Platform
Approximately 68% of online shoppers prefer to search for products on Google before making a purchase decision. This behavior highlights the dominant role of search engines in the consumer decision-making process. Businesses should prioritize optimizing their online presence and ensuring visibility on search engine results pages to capture the attention of potential customers during the crucial product research phase.
3. Contact Preference: Email Marketing
A substantial 61% of shoppers express a preference for brands to contact them via email. Furthermore, 49% of online shoppers welcome receiving promotional emails from their favorite brands weekly. Implementing effective email marketing strategies enables businesses to connect with customers directly, nurturing brand loyalty and driving repeat purchases.
4. Black Friday and Cyber Monday Statistics
Black Friday and Cyber Monday continue to be major shopping events for consumers worldwide. Online sales for Cyber Week, including the five days from Thanksgiving, were up 7.8% compared to last year. Online sales during Cyber Week (the five days from Thanksgiving to Cyber Monday) reached $38 billion.
Source: Abode Analytics
Merchants Statistics
Don't start your business or develop your business strategy blindly without looking at what your competitors are doing.
1. eCommerce Platforms
To understand the current e-commerce landscape, it is necessary to examine the various platforms used by online merchants. The table shows the number of stores using each e-commerce platform, the stores’ estimated monthly sales on different platforms, and the total number of apps, revealing their popularity and market share. Analyzing this data helps us measure the preference and success of merchants on different platforms.
WooCommerce is the most popular platform, with a market share of 34.17%. Shopify and Custom Cart follow closely behind with 20.61% and 12.17% respectively.

Source: AfterShip eCommerce Statistics
In terms of monthly sales on different e-commerce platforms, Custom Cart is the clear leader, accounting for 52.30% of total sales. WooCommerce and Shopify are the next top contenders, with sales figures of 8.80% and 8.70% respectively.

Source: AfterShip eCommerce Statistics
2. Estimated Monthly Sales by Category
Knowing which categories do well in eCommerce can help businesses make better strategic decisions. Here's a detailed analysis that provides accurate sales numbers for each product category found in online stores. Mass Merchants & Department Stores are leading the eCommerce market, with the highest monthly sales and an impressive overall market share of 9.03%.

Source: AfterShip eCommerce Statistics
3. Email Marketing for Small Businesses
Despite the rise of various marketing channels, email remains a critical tool for small businesses' customer acquisition efforts. With 81% of small businesses relying on emails, it is evident that this traditional method still holds significant value. Furthermore, personalizing emails yields higher open rates (50%), indicating the importance of tailored communication for engaging customers effectively.
4. Online Marketing Needs
While eCommerce dominates the digital landscape, it is surprising to discover that 33% of small businesses still do not have websites. This statistic showcases an opportunity for growth and improvement for small businesses to tap into the vast potential of online retail. Establishing an online presence could translate into increased reach and revenue for these enterprises.
5. Impact of 3D or 360-Degree Product Images
Visual content plays a crucial role in driving conversions in the eCommerce space. Research shows that utilizing 3D or 360-degree product images can lead to a remarkable 250% increase in conversion rates. This highlights the significance of providing customers with immersive and interactive experiences when showcasing products online.
6. Global Spending on Social Media Ads
Social media has become an integral part of advertising strategies, particularly for small and medium-sized businesses (SMBs). In 2021, global spending on social media ads reached an impressive $207.10 billion. This statistic reflects SMBs' growing enthusiasm for leveraging social media platforms to promote their products and connect with their target audience effectively.
US eCommerce Statistics 2023
1. E-commerce Sales Growth in the United States
The United States is experiencing a remarkable 50% growth in eCommerce sales. This substantial increase indicates the strong consumer demand for online shopping and presents businesses with opportunities to capitalize on this trend. Understanding the factors driving this growth is essential for businesses looking to excel in the US eCommerce market.
2. Revenue Generation in the US eCommerce Market
The eCommerce market in the United States continues to thrive, with staggering revenue projections. In 2023, it is expected to generate a revenue of $1.011 trillion, following a successful year in 2022 with $856.8 billion. This data demonstrates the consistent growth and vast potential within the US eCommerce industry.

Source: Statistics
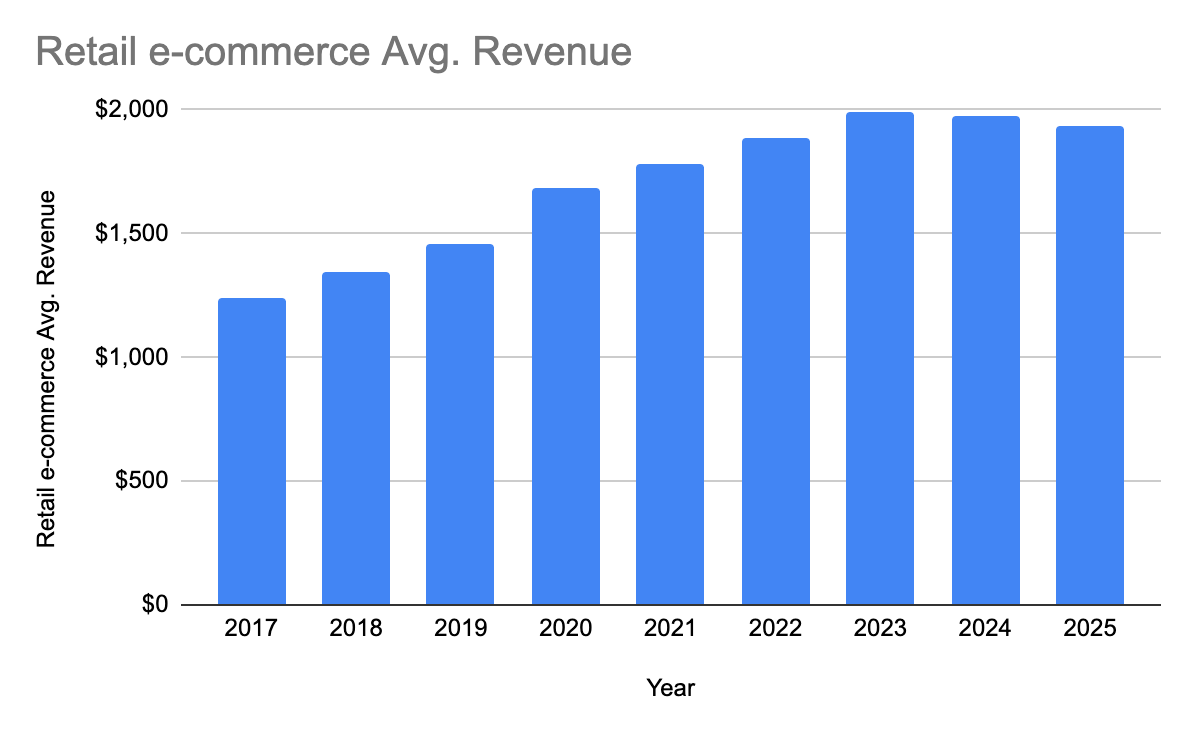
3. Retail eCommerce ARPU in the US
The Average Revenue Per User (ARPU) is an important measure that helps us understand how well retail eCommerce businesses are performing financially. Currently, retail e-commerce in the United States makes an average of $1,784.2 per user, and it is projected to reach $1,994 in 2023. By 2025, it is expected to generate $1,935 by the end of 2027.
Source: Statista
4. Impact of Social Media on US eCommerce
The influence of social media on eCommerce cannot be overstated. Nearly 30% of US internet users have made direct purchases through social platforms, highlighting the increasing role of social commerce.
Additionally, the United States leads the world in social media ad spending, reaching $72.33 billion in 2023 and emphasizing its significance in driving eCommerce sales. Analyzing the social media ad spending data provides valuable insights into the investment made by businesses to capture consumers' attention on these platforms.

Source: Yaguara
eCommerce Trends in 2024
As we look ahead to the future of eCommerce, these trends and statistics from 2023 shed light on the ever-evolving landscape. Mobile devices dominate online shopping, social media platforms wield immense purchasing power, and video content emerges as a powerful marketing tool. To stay competitive, businesses must embrace these trends, adapt their strategies, and prioritize optimizing their digital presence accordingly. By doing so, they can harness the potential of these emerging trends and thrive in the dynamic world of eCommerce.
1. Mobile Boost
Mobile phones have transformed the way we engage with online shopping, and their impact continues to grow significantly. Let's dive into the numbers:
1.1 Mobile phones generated 63% of online shopping orders.
- This staggering statistic highlights the increasing reliance on mobile devices for making purchases. Consumers are embracing the convenience and accessibility offered by smartphones, leading to a surge in mobile-driven transactions.
1.2 Mobile e-commerce sales reached $415.93 billion worldwide as of 2023, which is 6% more than in 2022.
- The steady growth of mobile e-commerce sales underscores its importance in the global retail landscape. As consumers become more comfortable with mobile shopping experiences, businesses must optimize their platforms to cater to this trend.
Insight: The continuous increase in mobile-generated orders and sales signifies the need for responsive and user-friendly mobile interfaces. Retailers and e-commerce businesses should prioritize mobile optimization to deliver seamless experiences and capture a significant share of the market.
2. Social Media
Social media platforms have evolved beyond just connecting people; they have become powerful vehicles for e-commerce. Here's what the data reveals:
2.1 Social e-commerce sales are $1.25 trillion worldwide as of 2023.
- Social media's ability to integrate shopping functionalities has turned it into a lucrative sales channel for businesses globally. Consumers are increasingly relying on these platforms to discover and purchase products.
2.2 By 2026, social media e-commerce sales will reach $2.9 trillion.
- This impressive projection demonstrates the immense potential of social media as a driver of e-commerce sales. As social platforms continue to enhance their shopping features, businesses must adapt to leverage this growing market.
2.3 Facebook is the most popular social media platform for social commerce transactions.
- Forbes' research identifies Facebook as the leading platform for social media shopping. With a vast user base and advanced advertising capabilities, Facebook offers businesses a powerful avenue to connect with potential customers.
Insight: To capitalize on the rising influence of social media in e-commerce, brands should establish a strong presence on platforms like Facebook, Instagram, and others. By leveraging targeted advertising and engaging content, businesses can tap into the vast consumer base and drive sales through social media channels.
3. Video Content and Live-Shopping
Video content has emerged as a compelling tool for marketers, drawing the attention of both businesses and consumers alike. Let's examine the relevant statistics:
3.1 In 2023, 91% of businesses use video as a marketing tool.
- This data showcases the widespread adoption of video content by businesses across various industries.
3.2 The number of marketers that shared video content on LinkedIn rose to 65% in 2021.
- LinkedIn's emergence as a video-sharing platform indicates the expanding reach of video content beyond traditional social media channels. Marketers recognize the value of video in driving engagement and building professional networks.
Insight: The high adoption rate of video marketing suggests that businesses find it instrumental in increasing brand awareness and driving conversions. With 93% of marketers seeing video content as important to their strategies, companies should invest in creating high-quality video content that resonates with their target audience.
Conclusion
The year 2023 has proven to be a pivotal period for the eCommerce industry, with notable advancements and significant transformation taking place on a global scale. Through an in-depth analysis of comprehensive data and insights, this article has shed light on the current landscape and future projections of eCommerce.
Comments ()